
Skip to content
Clash Watchdoglab count
Menu

Games library

Every game on the board with what has been counted so far. Filter by category or provider, then sort by a measured figure.

8 of 34 games shown 8 measured

Crash games compared side by side

Every game in the library

  1. Dice cover art by Spribe

    Dice

    Spribe logoProvably fairMeasured

    97.3%95% CI 96.7–97.9

    n 114,362as of 17 Oct 2026, 10:27 UTC

    Return per round · Roll over 51.48 (win pays 2.00x), stake 1 · USD demo

    114,362n rounds

    97.3%95% CI 96.7–97.9as of 17 Oct 2026, 10:27 UTC

  2. Keno cover art by Spribe

    Keno

    Spribe logoProvably fairMeasured

    96.8%95% CI 95.9–97.7

    n 228,740as of 17 Oct 2026, 10:28 UTC

    Return per round · Pick 5 numbers of 36, 10 drawn, stake 1 · USD demo

    228,740n rounds

    96.8%95% CI 95.9–97.7as of 17 Oct 2026, 10:28 UTC

  3. Mines cover art by Spribe

    Mines

    Spribe logoProvably fairMeasured

    96.2%95% CI 95.7–96.7

    n 44,115as of 17 Oct 2026, 10:27 UTC

    Return per round · 3 mines, cash out after 2 picks (a mine ends the round early), stake 1 · USD demo

    44,115n rounds

    96.2%95% CI 95.7–96.7as of 17 Oct 2026, 10:27 UTC
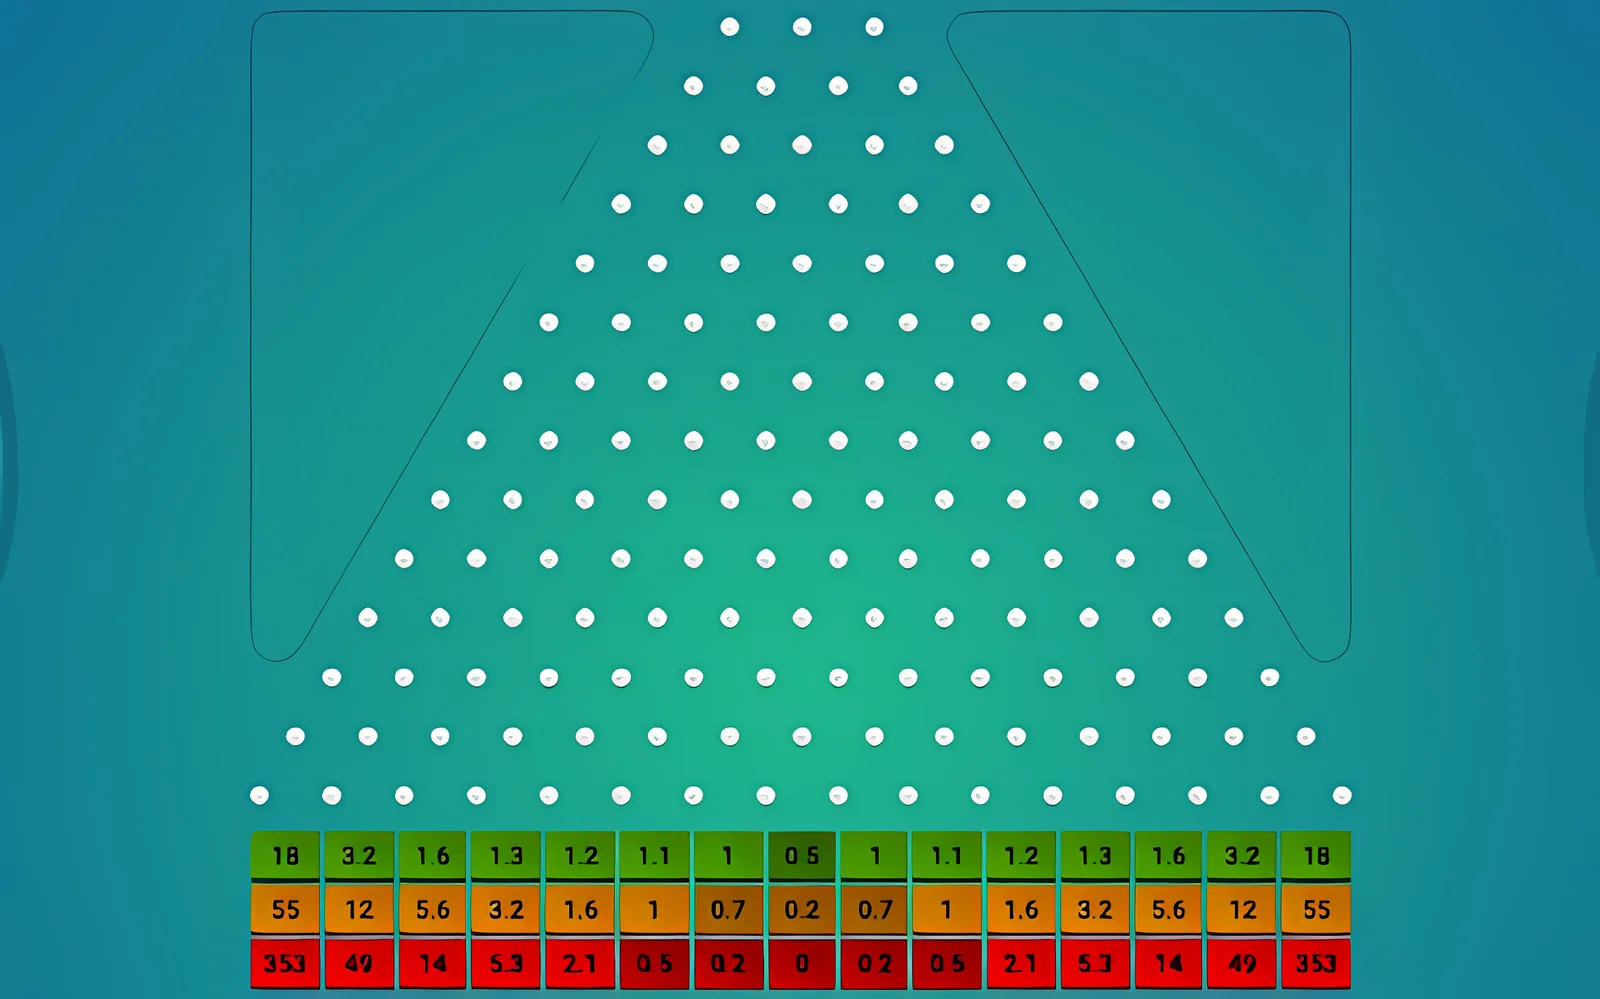
  4. Plinko cover art by Spribe

    Plinko

    Spribe logoProvably fairMeasured

    97.1%95% CI 96.8–97.4

    n 72,837as of 17 Oct 2026, 10:27 UTC

    Return per round · Green colour, 14 pins, stake 1 · USD demo

    72,837n rounds

    97.1%95% CI 96.8–97.4as of 17 Oct 2026, 10:27 UTC

  5. Chicken Road cover art by InOut Games

    Chicken Road

    InOut Games logoUnverifiableMeasured

    98.1%95% CI 97.6–98.6

    n 72,136as of 17 Oct 2026, 10:28 UTC

    Return per round · Medium difficulty, cash out after 3 steps (a collision ends the round early), stake 1 · USD demo

    72,136n rounds

    98.1%95% CI 97.6–98.6as of 17 Oct 2026, 10:28 UTC

  6. Chicken Road 2 cover art by InOut Games

    Chicken Road 2

    InOut Games logoUnverifiableMeasured

    96.2%95% CI 95.8–96.5

    n 71,666as of 17 Oct 2026, 10:28 UTC

    Return per round · Medium difficulty, cash out after 2 steps (a collision ends the round early), stake 1 · USD demo

    71,666n rounds

    96.2%95% CI 95.8–96.5as of 17 Oct 2026, 10:28 UTC

  7. Plinko (BGaming) cover art by BGaming

    Plinko (BGaming)

    BGaming logoHash-committedMeasured

    99.3%95% CI 95.8–102.8

    n 136,728as of 17 Oct 2026, 10:29 UTC

    Return per round · High risk, 16 rows, stake 1 · FUN demo

    136,728n rounds

    99.3%95% CI 95.8–102.8as of 17 Oct 2026, 10:29 UTC

  8. Plinko X cover art by SmartSoft

    Plinko X

    SmartSoft logoCertified RNGMeasured

    99.0%95% CI 96.8–101.2

    n 927,226as of 17 Oct 2026, 10:30 UTC

    Return per round · High volatility (0.2x–1,000x slots, random 1x/5x/10x balls), stake 50 · DMO demo

    Wider interval: no outcome probabilities published; see the game page.

    927,226n rounds

    99.0%95% CI 96.8–101.2as of 17 Oct 2026, 10:30 UTC

What the columns mean
Observed RTP @ 2x (fixed cash-out)
If every round were cashed out automatically at 2x, this is the long-run return measured in the current sample. With a small sample it can differ noticeably from the theoretical value.
RTP stability
The margin of error of the observed RTP @ 2x (fixed cash-out): half the width of its 95% interval. A narrower margin means a larger, steadier sample, not a better game.
Median crash
Half of the results fall below this multiplier and half above it. Compared with the highest multiplier, the median is closer to what a typical round is like.
Instant crash rate
The share of rounds that crash at a very low multiplier. It describes the risk in the low tail.
Survival at 2x, 5x, 10x
The share of rounds that reached the multiplier, derived from the observed return at that cash-out (RTP at t divided by t). Its interval is the RTP interval divided by t. History, not a forecast.
Highest multiplier
The highest multiplier seen in the sample. It does not make a similar multiplier any more likely in the next round.
Sample size
How many recorded rounds this figure is based on. The more rounds, the narrower the interval around a measured value.
95% interval
The range that would contain the true long-run value in 95 of 100 repeated samples of this size. It narrows as more rounds are counted.